Dear Jasmine,
1,2,6: I am using PRO Version number 20.0.8.1 the support send me two weeks ago
3: Would be great 🙂
4, 7: Unfortunately not what I am looking for, can you ask the team to implement this, is also as in topic 7 shown would be cool
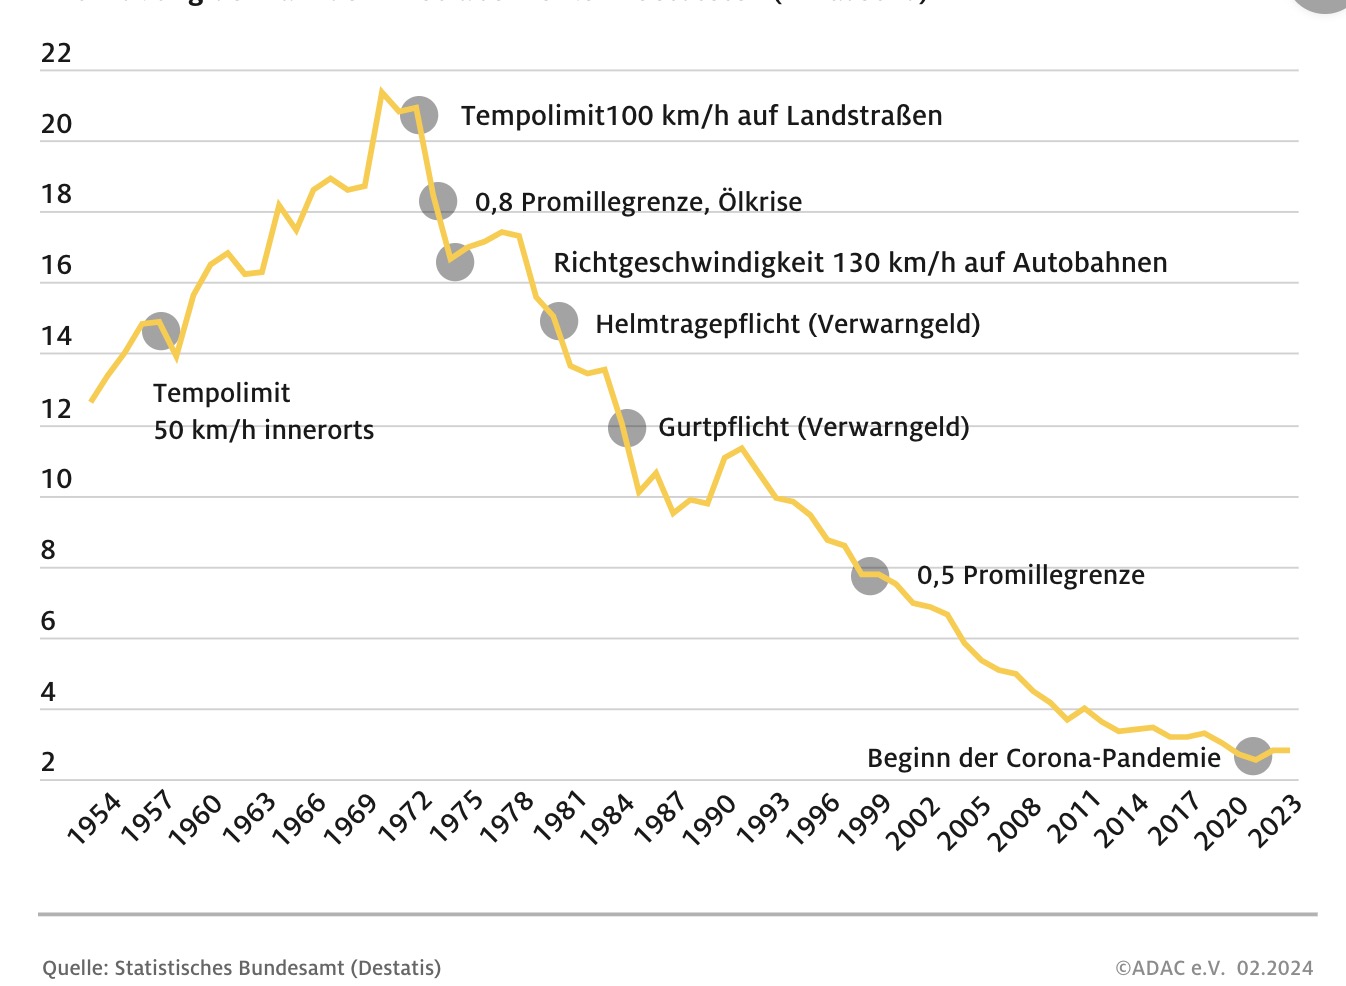
7. Is it also possible to put some more information into a graph, as shown on this one:
https://www.oli.net/wp-content/uploads/2024/04/Screenshot-2024-04-15-at-11.40.51.jpg
Perfect, that works fine! 🙂
Thanks for feedback, that worked for me. But so I have to create the table in Excel and import. Creating it online is not possible to create a chart from this? (Free not pro version)