

Description
W3NetLab Debug Log Console helps administrators troubleshoot WordPress without exposing PHP errors on the public website.
It goes beyond a basic log viewer by combining controlled debug activation, automatic shutoff, runtime verification, protected storage, and memory-safe inspection in one dashboard tool.
Standout features
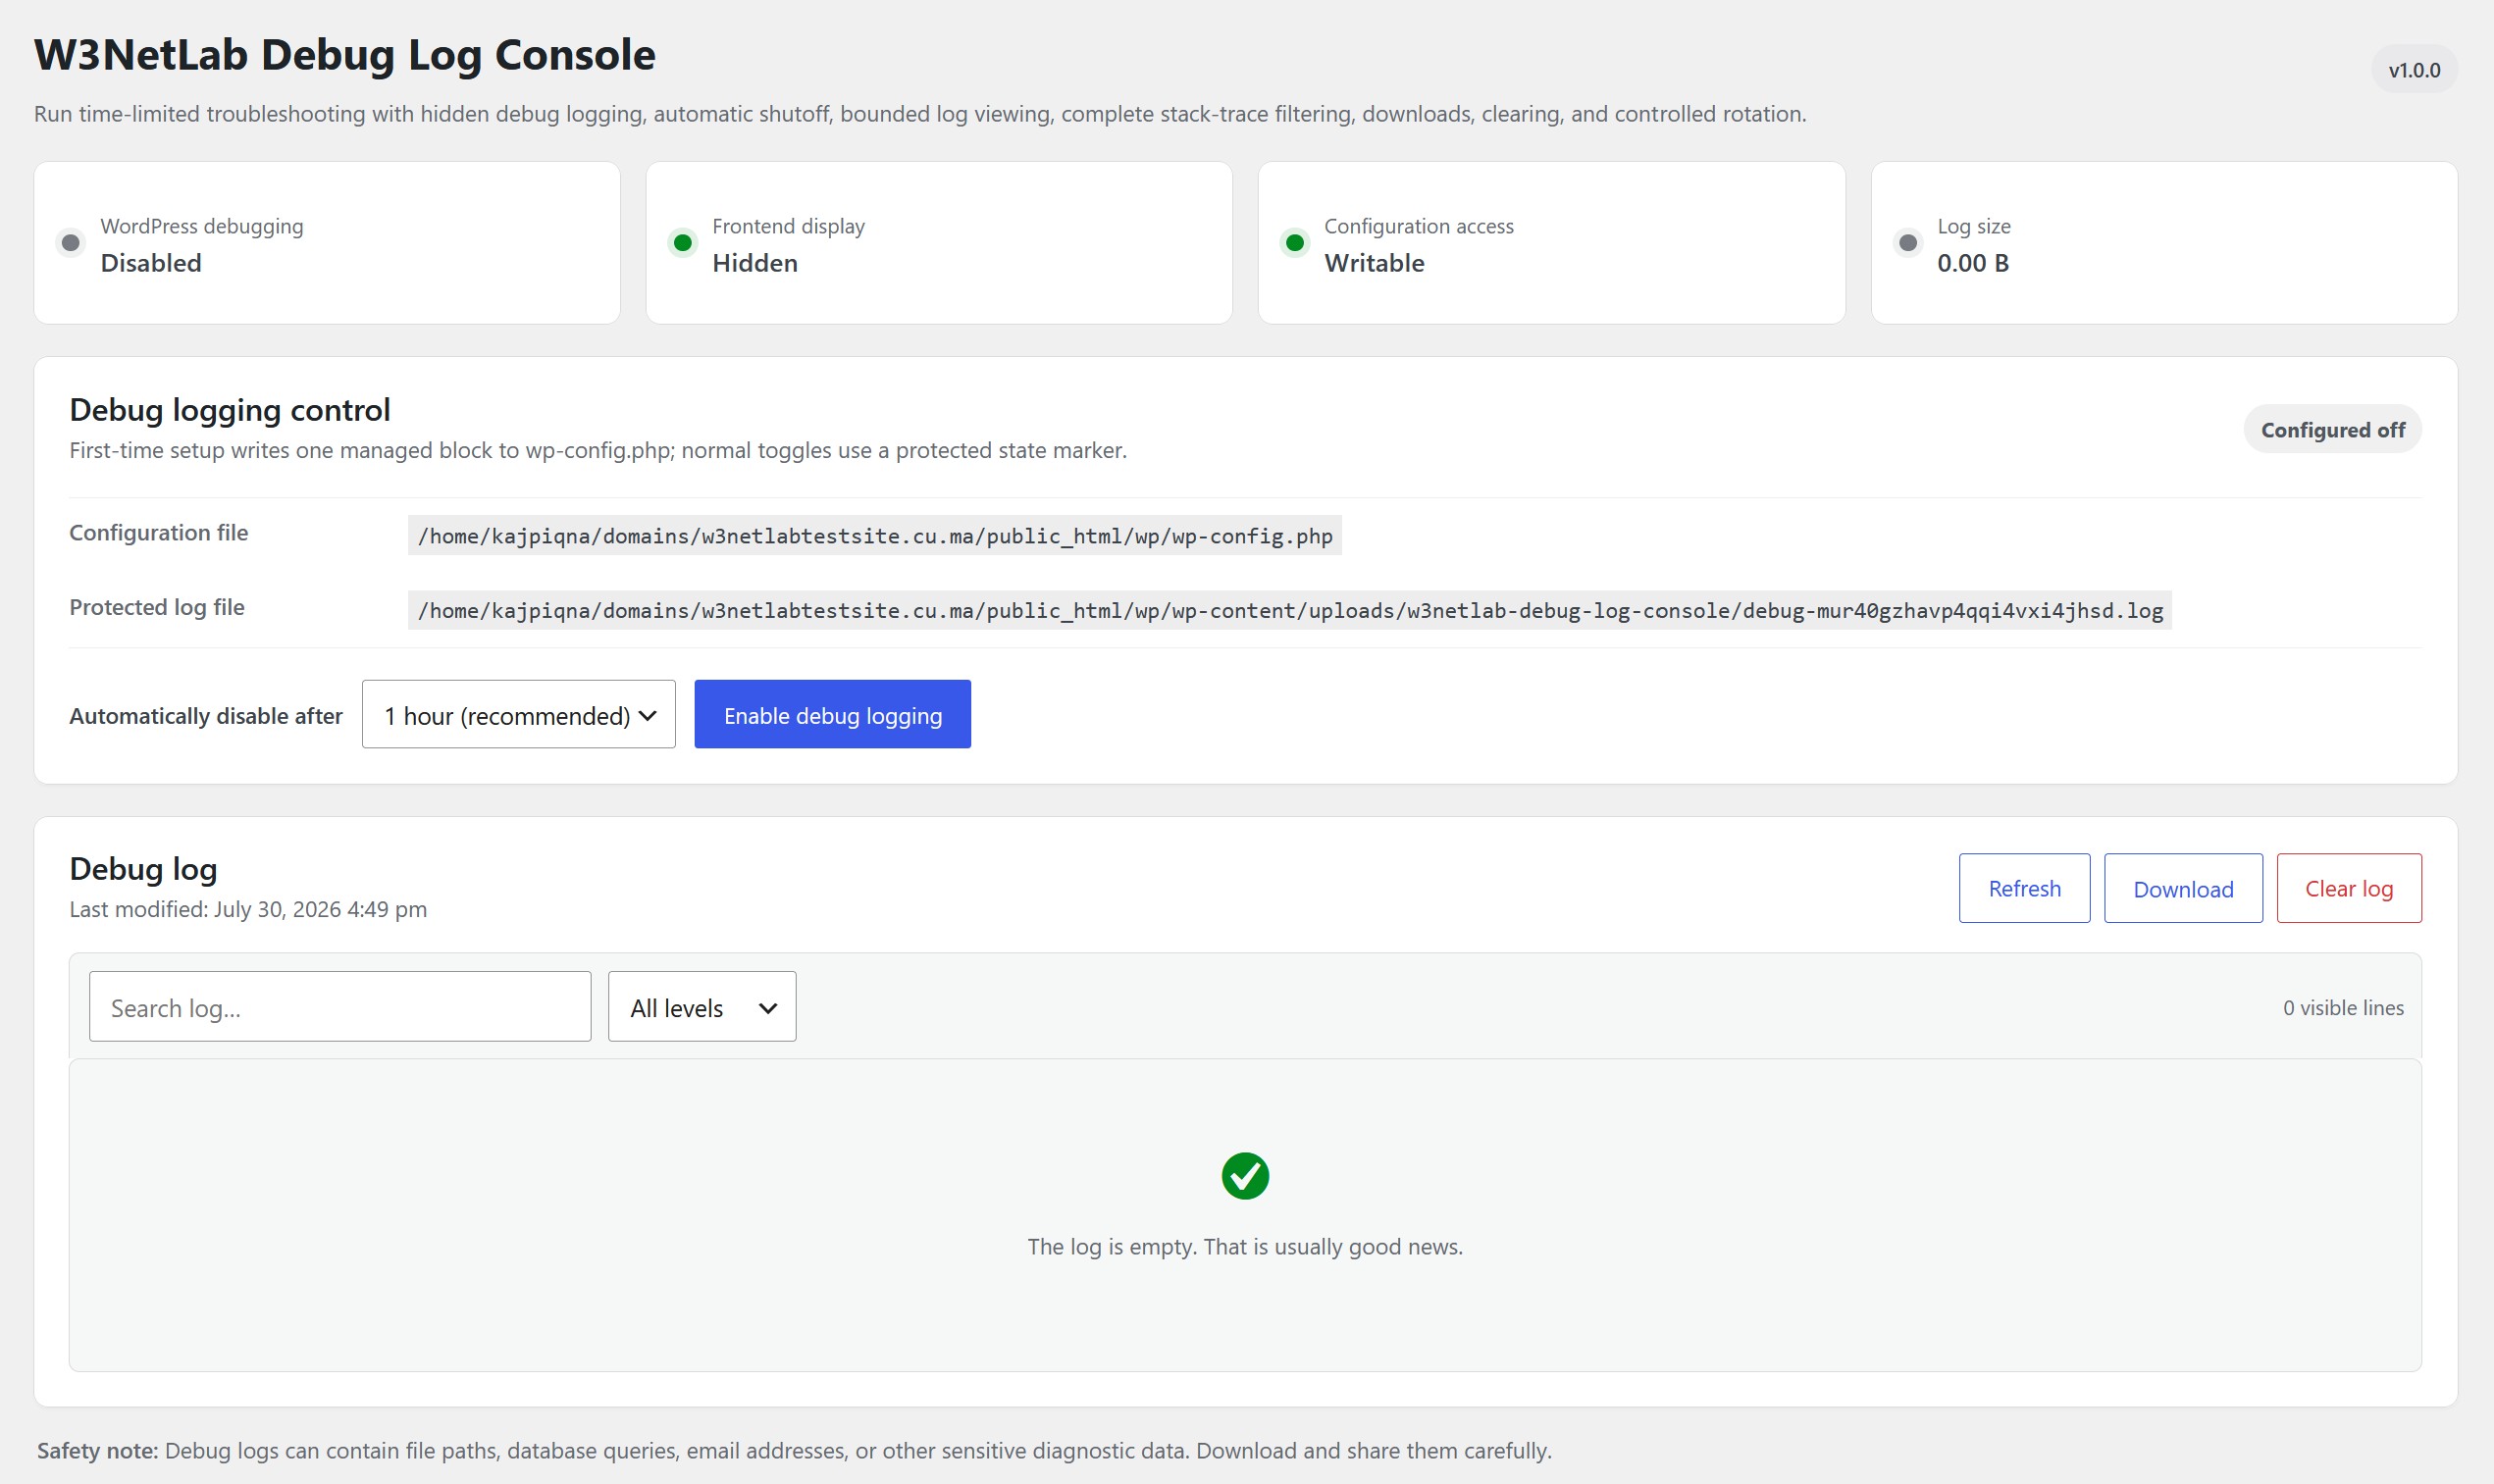
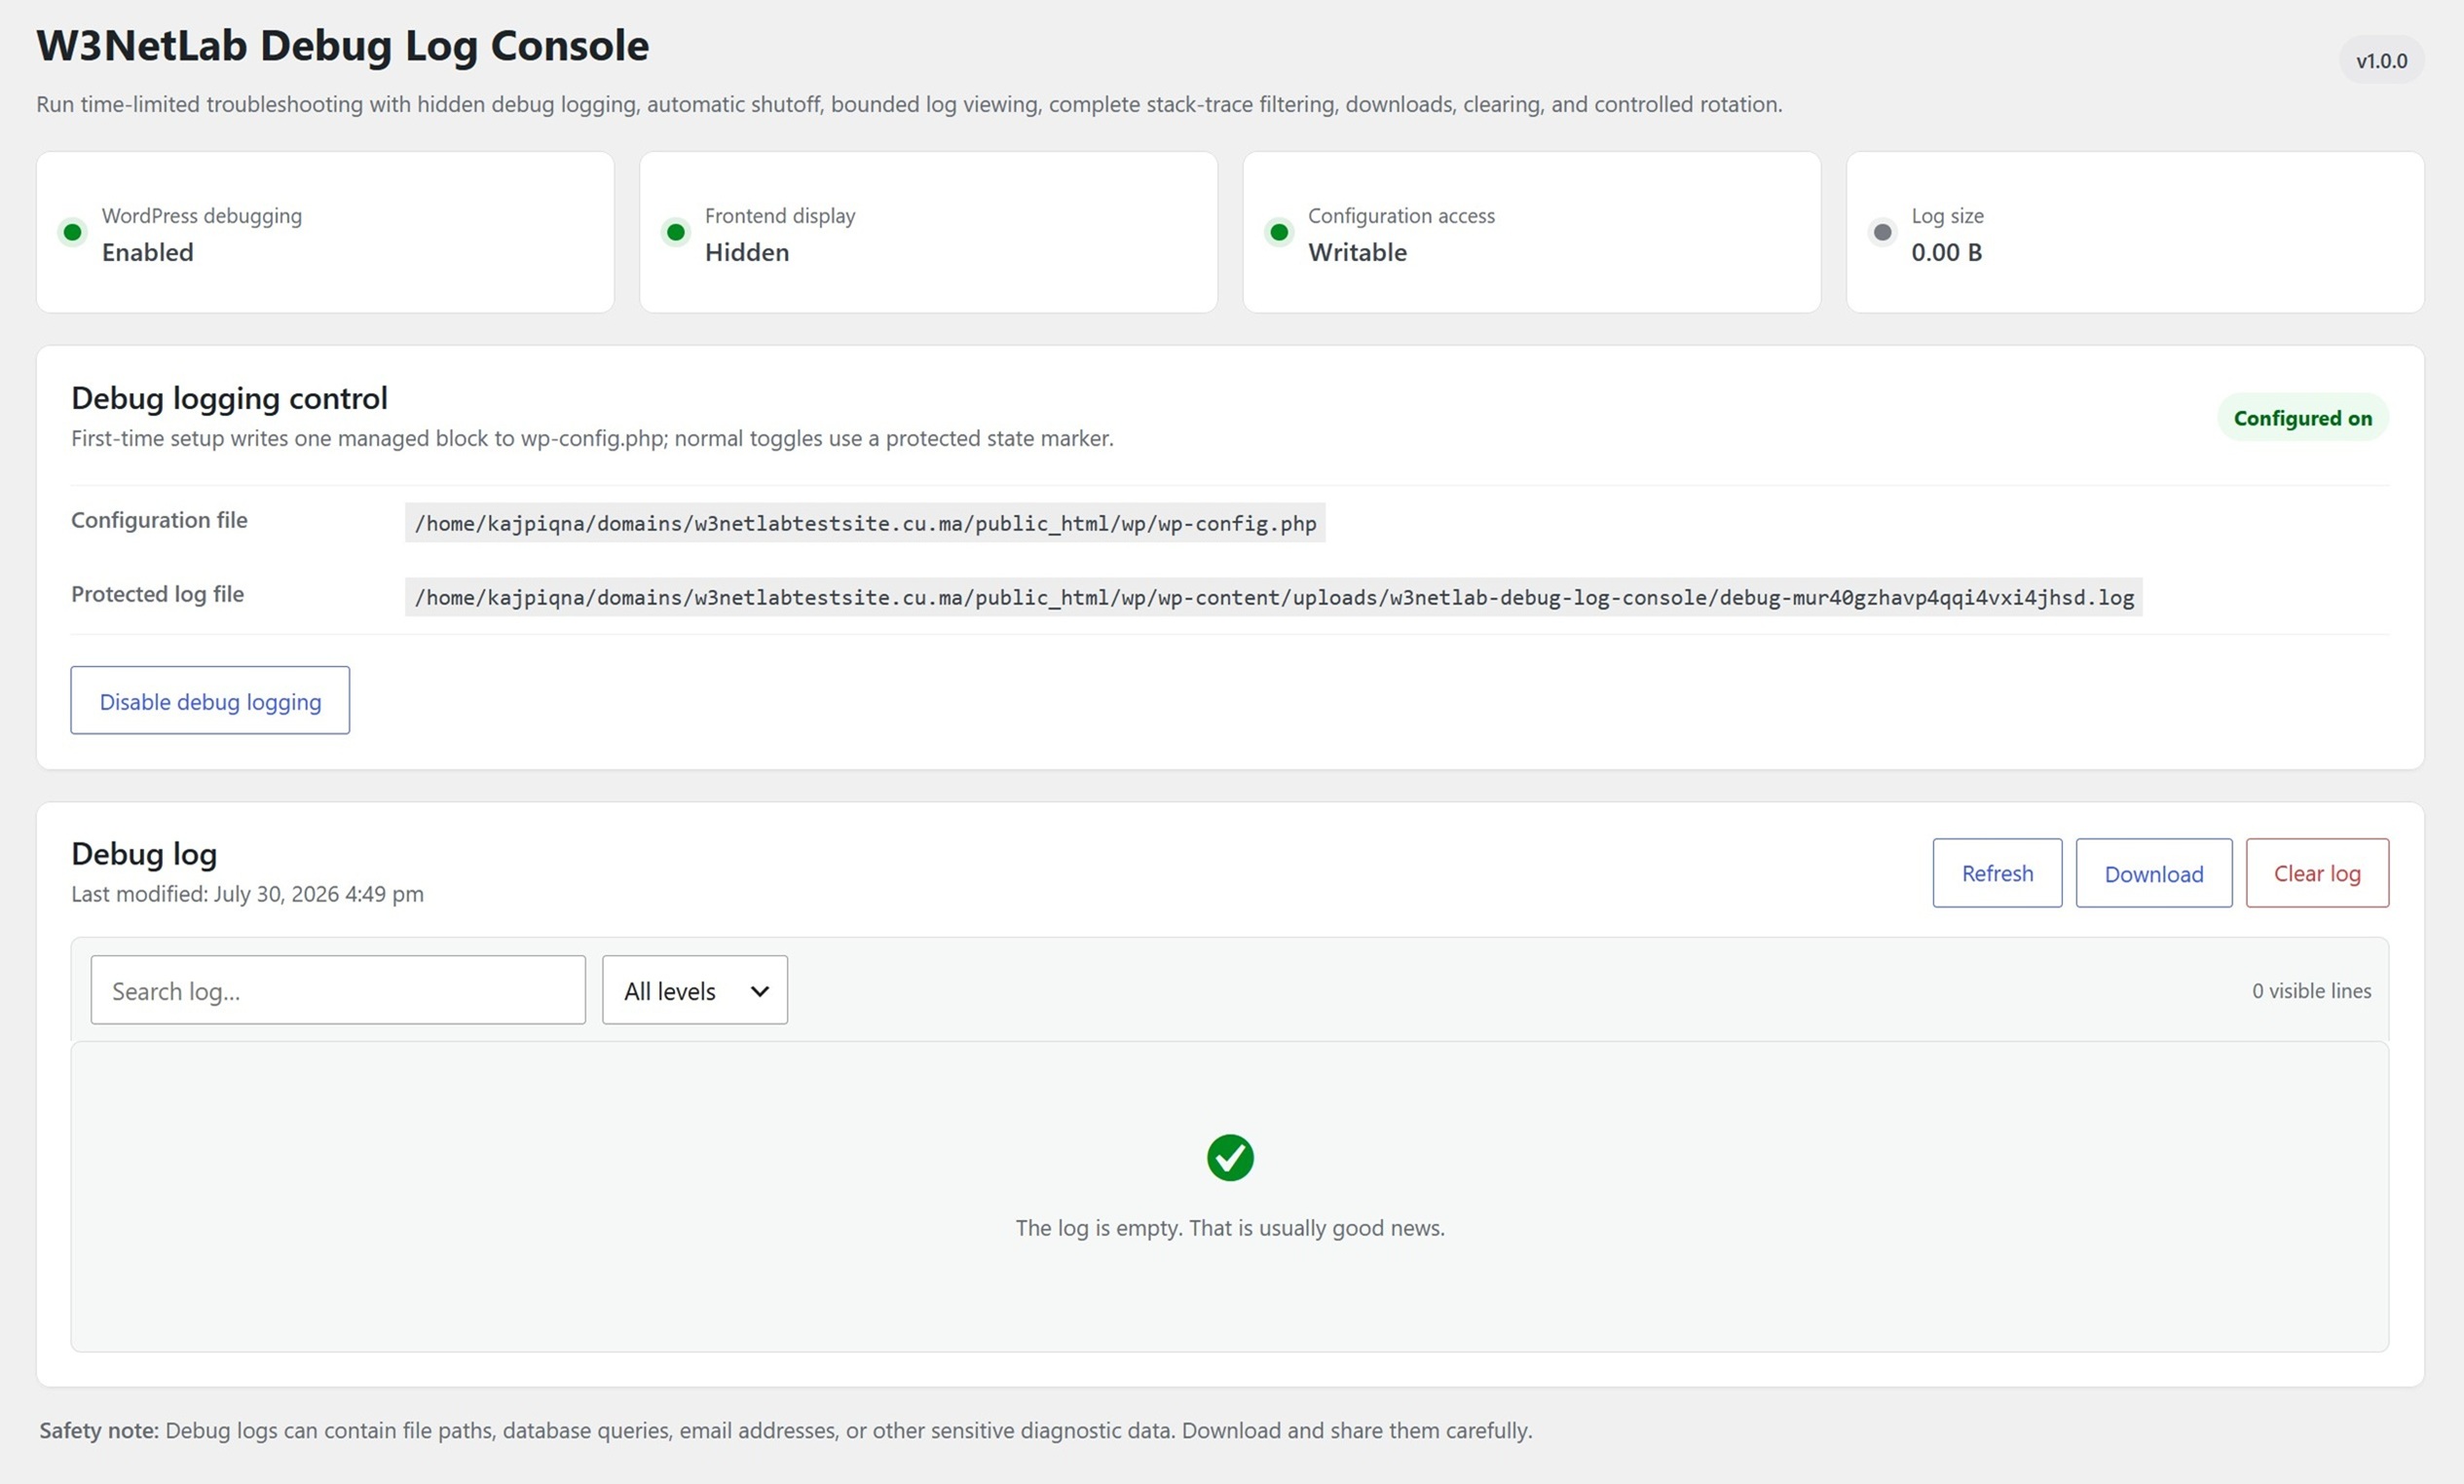
- Enable or disable debug logging from Tools > Debug Log Console.
- Keep frontend error display disabled while logging is active.
- Automatically stop logging after 10 minutes, 30 minutes, 1 hour, 6 hours, or 24 hours.
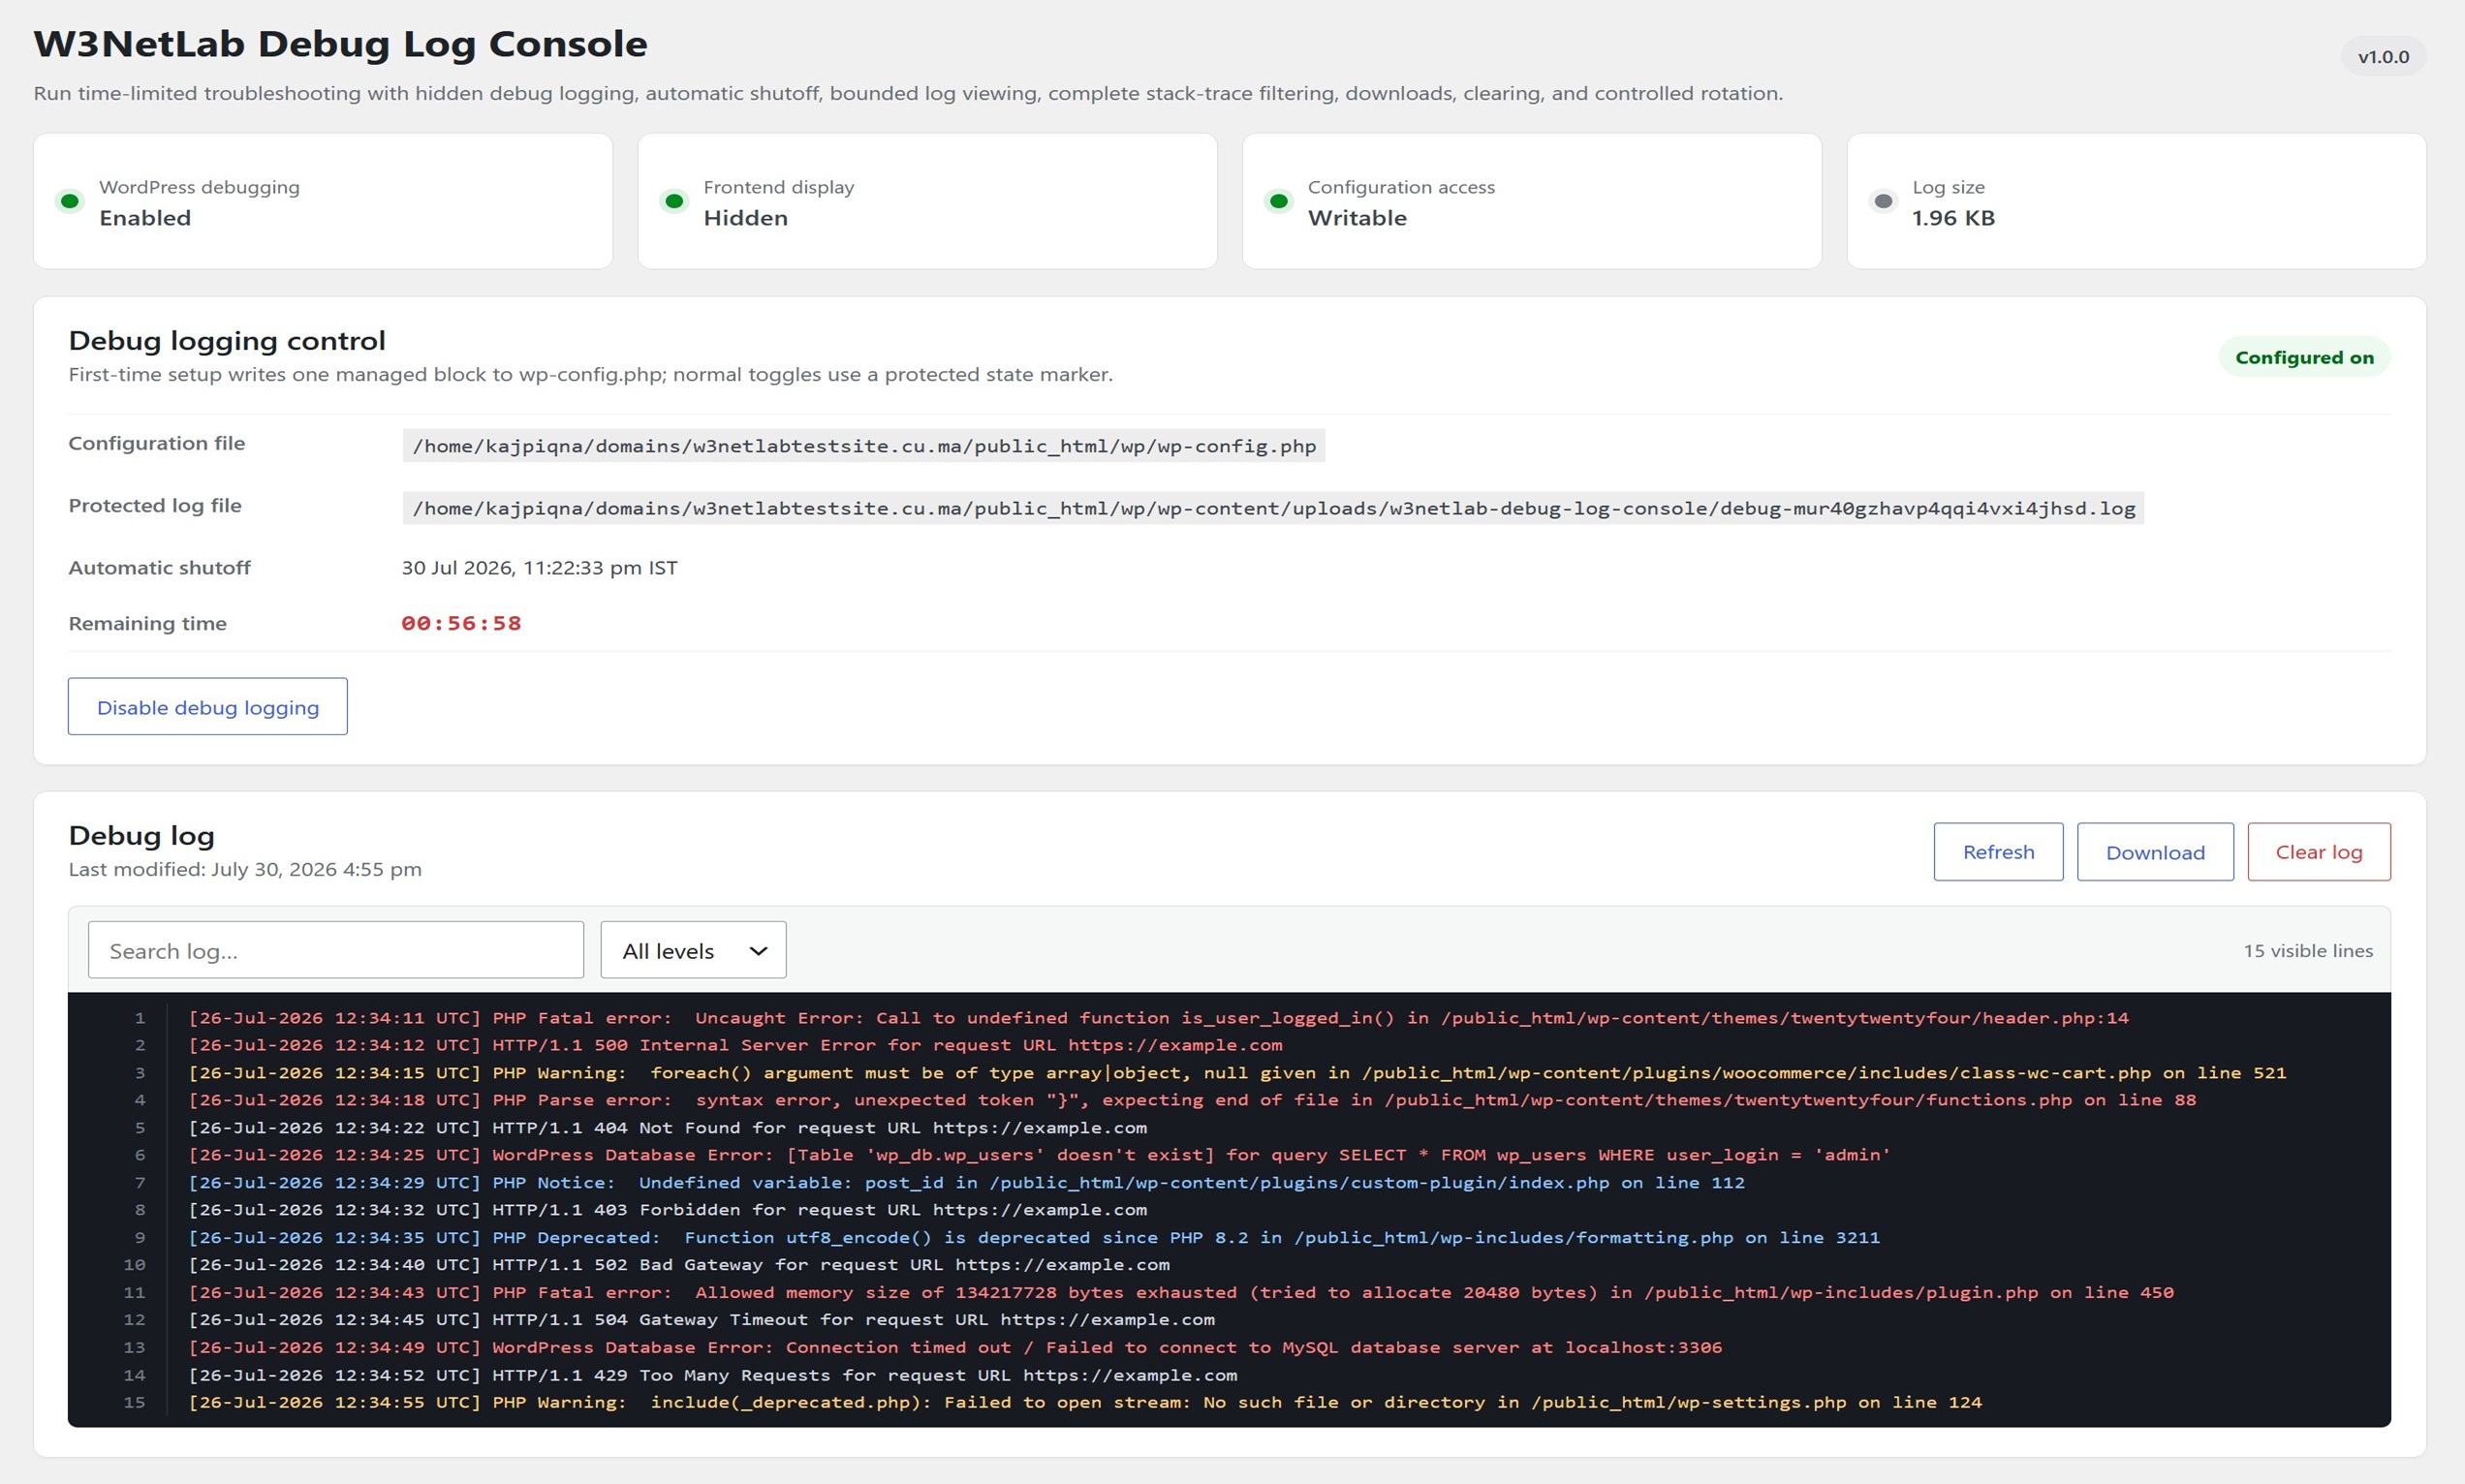
- See the local shutoff time and a live
hh:mm:sscountdown. - Search and filter complete multi-line entries without losing stack traces.
- Read only the newest 512 KB and display up to 1,500 lines to avoid large-log memory exhaustion.
- Download, clear, or rotate the active log through protected administrator actions.
- Verify that the loaded debug constants match the requested state and fail safely when they do not.
- Detect existing debug definitions and resolve only supported cases after explicit administrator approval.
- Store logs locally with no telemetry, tracking, remote assets, or external log service.
Protected log storage
Logs are stored in a w3netlab-debug-log-console folder under the runtime uploads directory resolved by WordPress. The active log uses a randomized filename.
The plugin creates Apache/OpenLiteSpeed and IIS access-control files plus an index file. It validates paths, rejects symbolic links, and never creates temporary PHP files beside wp-config.php.
Configuration safety
Automatic setup is available only when WordPress has safe direct access to a regular, writable wp-config.php file. Updates are limited to recognized debug definitions and the plugin-owned block, then read back and verified. If verification fails, the plugin attempts to restore the original content.
Normal enable, disable, and automatic-shutoff operations use a protected marker. If the requested configuration does not take effect, the marker is removed and logging is not reported as enabled.
Screenshots
Installation
- Install and activate W3NetLab Debug Log Console.
- Open Tools > Debug Log Console.
- Choose a shutoff duration and click Enable debug logging.
On multisite, use Network Admin > Settings > Debug Log Console.
FAQ
-
Are errors displayed to website visitors?
-
No. The managed configuration keeps
WP_DEBUG_DISPLAYdisabled. -
How are large logs handled?
-
The viewer reads only the final 512 KB and displays no more than 1,500 lines. Downloads are streamed in small chunks. Logs larger than 10 MB can be moved into one protected previous-log archive.
-
Safe direct configuration access or protected uploads storage may be unavailable, or unsupported debug definitions may already control WordPress. The plugin remains disabled and shows the detected condition. For host-managed configuration, contact the hosting provider.
-
What happens when the plugin is deactivated?
-
The enable marker is removed first. The plugin then removes its managed configuration block and restores any supported definitions it previously preserved. Existing log data remains available if the plugin is activated again.
-
What happens when the plugin is deleted?
-
Uninstall removes plugin options, protected log storage, the standard managed configuration block, and any supported definitions the plugin previously preserved.
-
Does the plugin send data anywhere?
-
No. Logs and settings stay on the WordPress installation.
Reviews
There are no reviews for this plugin.
Contributors & Developers
“W3NetLab Debug Log Console” is open source software. The following people have contributed to this plugin.
Contributors
Translate “W3NetLab Debug Log Console” into your language.
Interested in development?
Browse the code, check out the SVN repository, or subscribe to the development log by RSS.
Changelog
1.0.0 – 2026-07-31
- Initial release.