
Description
Qndrs Availability and Heartbeat Monitor checks external URLs from the WordPress dashboard and can also monitor firewalled clients through outbound heartbeat pings. It supports multiple monitored URLs, per-URL monitoring toggles, email alerts, configurable Pushover alerts, status history, response times, uptime percentages, JSON import/export, structured logging, heartbeat monitors, and authenticated REST endpoints.
External services
This plugin can optionally send downtime and recovery notifications through Pushover. Pushover is disabled by default and is only used when a site administrator configures Pushover credentials and enables Pushover alerts for a monitor.
When Pushover is enabled, the plugin sends an HTTPS POST request to https://api.pushover.net/1/messages.json. The request contains the configured Pushover application token, the configured Pushover user or group key, and a notification title/message with the monitored URL or monitor name, status information, and HTTP status code or error message when available.
Pushover API documentation: https://pushover.net/api
Pushover terms: https://pushover.net/terms
Pushover privacy policy: https://pushover.net/privacy
Screenshots
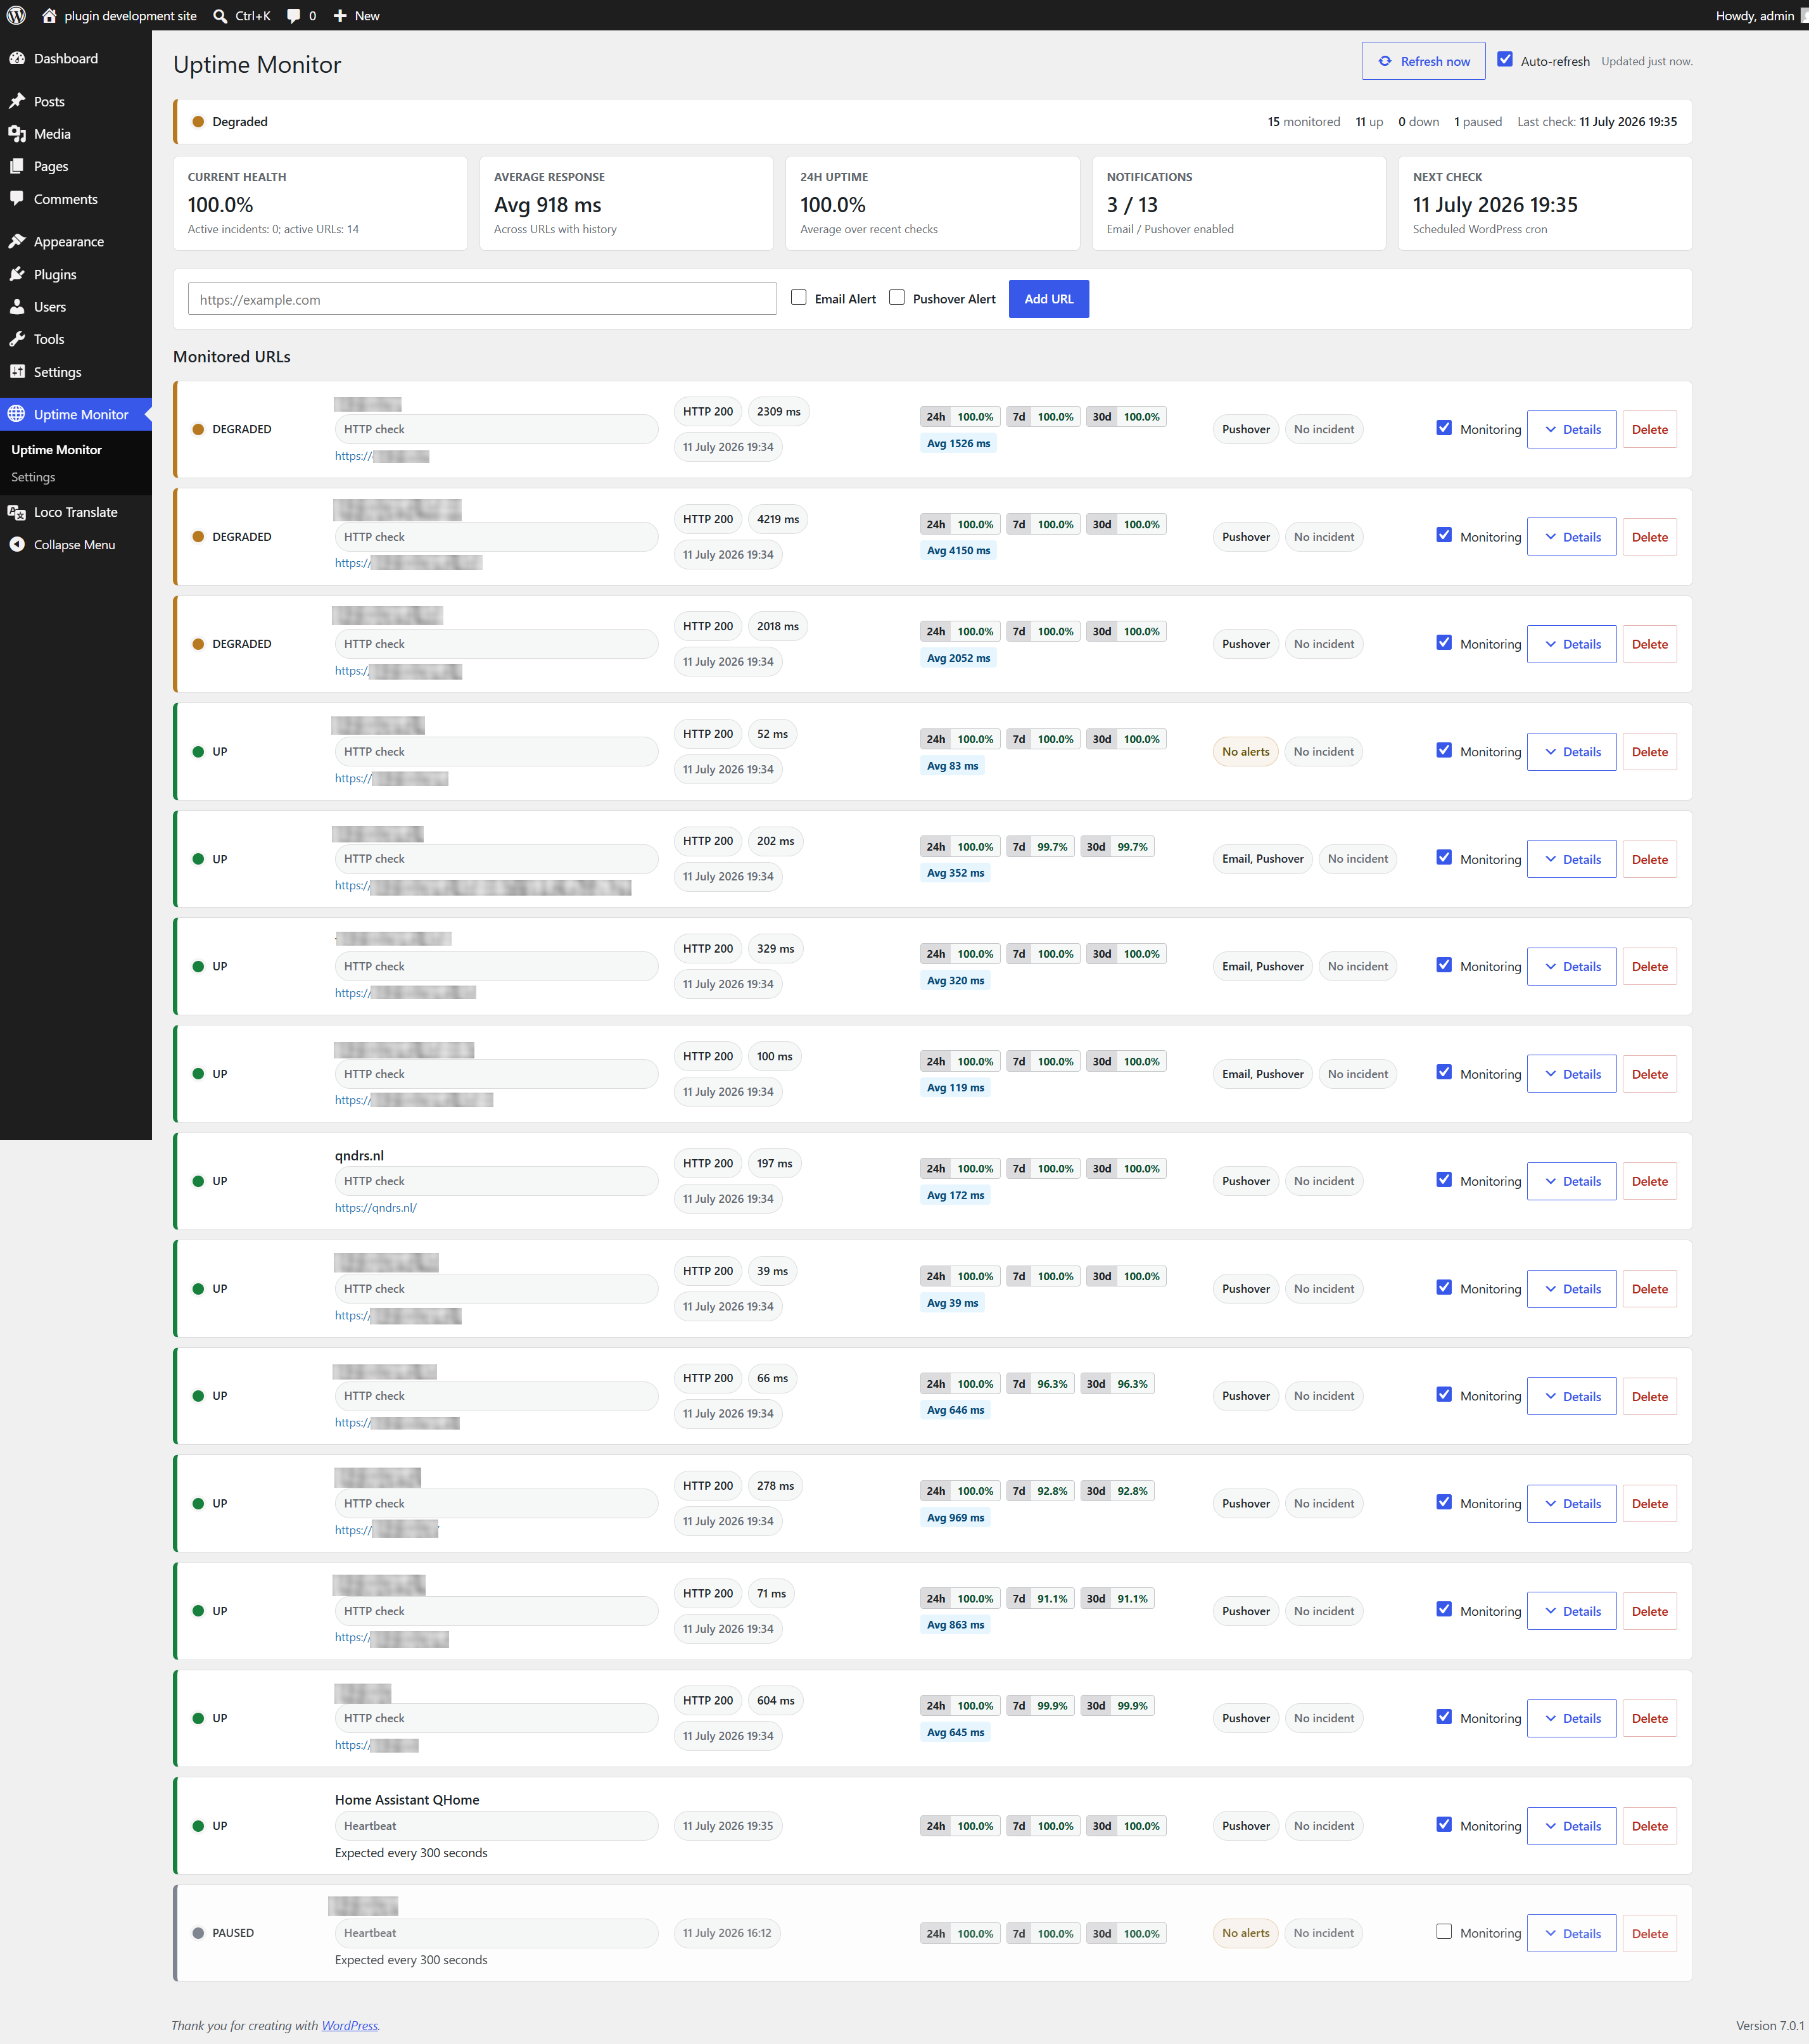
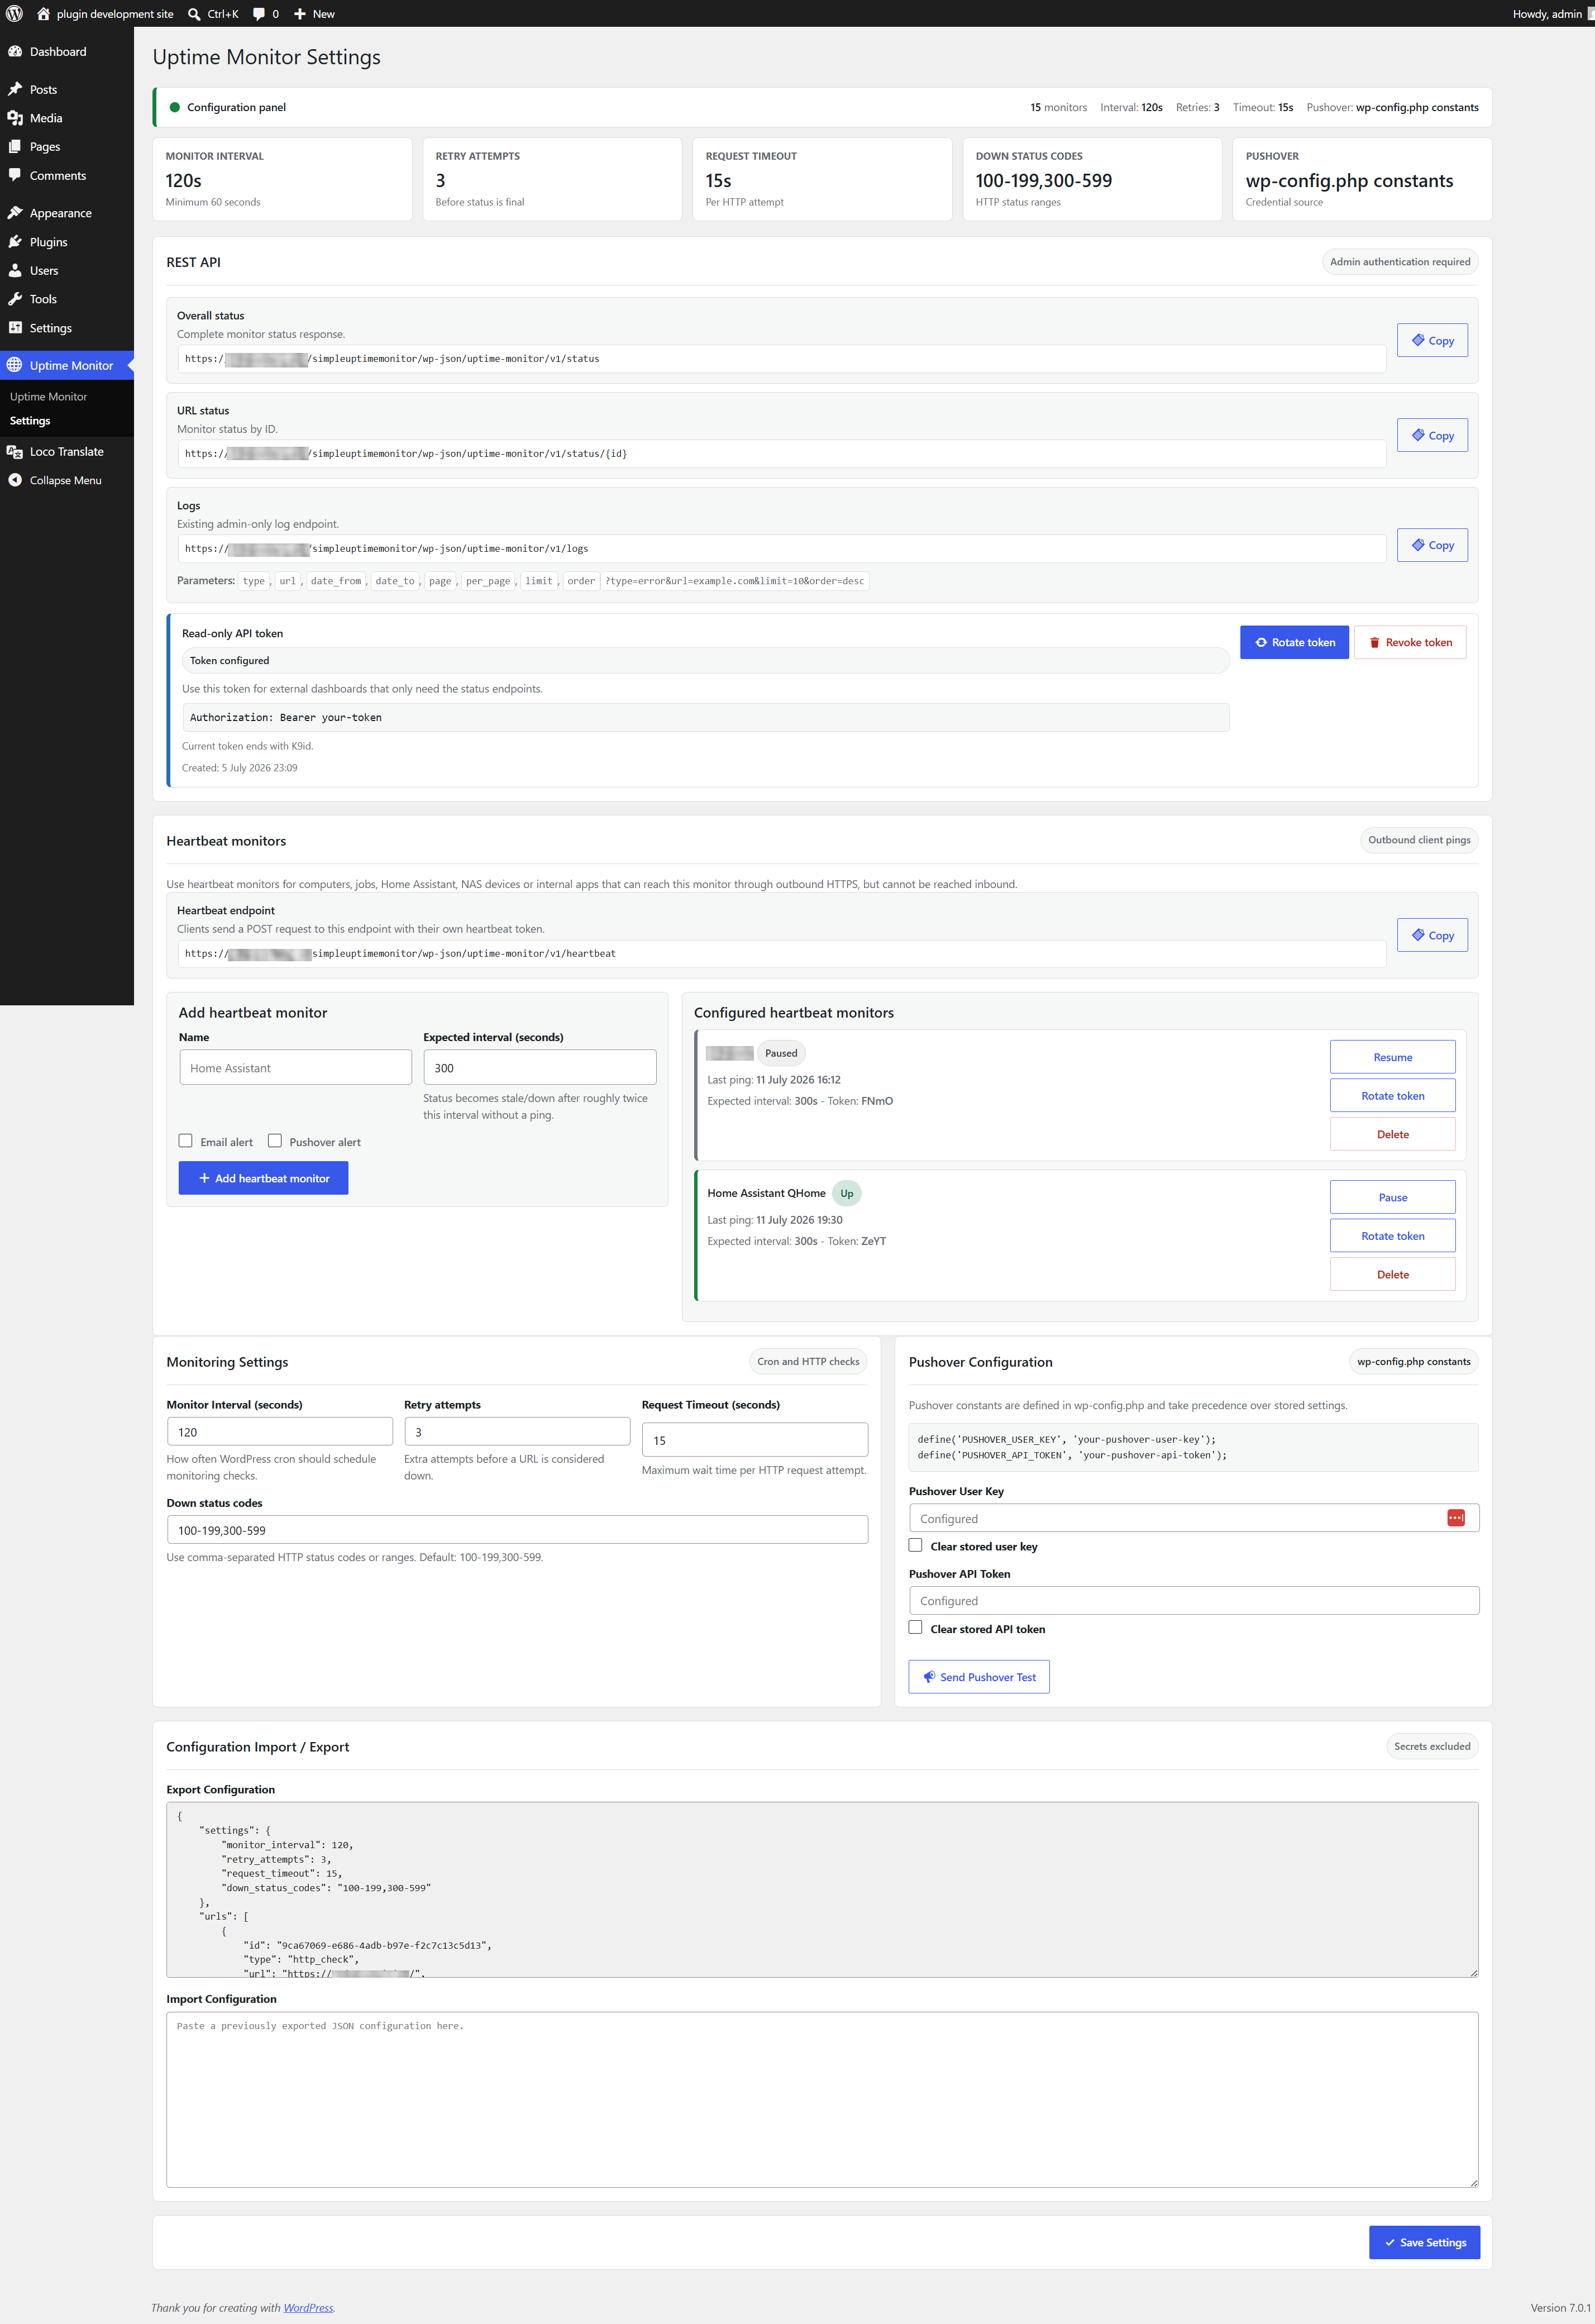
Installation
- Upload the plugin folder to
/wp-content/plugins/qndrs-availability-heartbeat-monitor. - Activate Qndrs Availability and Heartbeat Monitor from the WordPress plugins page.
- Open Qndrs Monitor in the WordPress admin menu.
- Add one or more URLs and choose notification channels.
For more reliable checks, configure a real server cron to call wp-cron.php.
FAQ
-
How do I configure Pushover?
-
Configure Pushover credentials from the plugin settings page. Stored credentials are masked and are not included in JSON exports.
You can also add these constants to
wp-config.php; constants take precedence over stored settings:define('PUSHOVER_USER_KEY', 'your-user-key'); define('PUSHOVER_API_TOKEN', 'your-api-token'); -
Where are logs stored?
-
Logs are stored in the WordPress database option
qndrs_ahm_logsand capped to avoid unbounded growth. The REST log endpoint supportstype,url,date_from,date_to,page,per_page,limit, andorderquery parameters. -
Is the REST endpoint public?
-
No. REST endpoints require a user with the
manage_optionscapability or the plugin read-only API token. -
How do heartbeat monitors work?
-
Create a heartbeat monitor from the settings page. The plugin shows a one-time token and curl example. A client sends outbound HTTPS POST requests to
/wp-json/qndrs-availability-heartbeat-monitor/v1/heartbeat; the monitor becomes stale/down when no ping arrives in time.Detailed heartbeat client examples are included in
docs/heartbeat-monitors.md. Dutch documentation is included indocs/heartbeat-monitors.nl.md.
Reviews
There are no reviews for this plugin.
Contributors & Developers
“Qndrs Availability and Heartbeat Monitor” is open source software. The following people have contributed to this plugin.
Contributors
Translate “Qndrs Availability and Heartbeat Monitor” into your language.
Interested in development?
Browse the code, check out the SVN repository, or subscribe to the development log by RSS.
Changelog
3.5.1
- Renamed the plugin for WordPress.org review with a distinctive Qndrs display name and slug.
- Prefixed AJAX actions, REST namespace, cron hooks, options and token headers to avoid naming collisions.
- Improved the release zip structure for WordPress plugin uploads.
3.5.0
- Added heartbeat monitors for firewalled machines, jobs, Home Assistant, NAS devices and internal apps.
- Added a token-protected heartbeat REST endpoint with manual token rotation.
- Added heartbeat monitor management to the settings page with copyable endpoint and curl examples.
- Added documentation for cron, systemd timers, Windows Task Scheduler and Home Assistant heartbeat clients.
3.4.0
- Added live dashboard refresh without full page reload.
- Added optional auto-refresh for the Qndrs Monitor admin dashboard.
- Added automatic WordPress dashboard widget refresh with a visual countdown indicator.
3.3.0
- Added a compact WordPress dashboard widget for monitoring status.
- Shows active incidents and non-up URLs directly on the WordPress dashboard.
- Added a subtle alarm beacon for active incidents.
3.2.0
- Added filters and pagination to the REST log endpoint.
- Added read-only API token access for filtered log responses.
- Documented supported log query parameters in the REST API viewer and README.
3.1.1
- Fixed dashboard date/time display to use day-month-year and 24-hour time.
- Improved AJAX error handling so HTTP and SSL validation errors are shown clearly.
- Sorted active incidents and down URLs to the top of the dashboard list.
3.1.0
- Added per-URL status history, response time tracking, and uptime percentages.
- Added recovery notifications and throttled downtime alerts per incident.
- Added configurable retry attempts, request timeout, and down status code ranges.
3.0.1
- Fixed cron scheduling on activation and settings changes.
- Added data normalization for existing and imported URL records.
- Added explicit capability checks for AJAX actions.
- Improved URL and import validation.
- Fixed admin table rendering after AJAX updates.
- Hardened JSON log handling and REST log responses for large log files.
- Cleaned README encoding and release documentation.
3.0.0
- Updated Dutch language files.
- Extended logging for REST access.
2.9.0
- Added toggle per URL to disable or enable monitoring.
- Improved REST implementation and JSON logging.
- Added JSON import and export for full configuration.
1.0.0
- Initial release with URL monitoring and email alerts.