Hi,
thanks for your post. That’s indeed an interesting suggestion, and I’ve already been thinking about something like this.
Unfortunately, I don’t see nice ways to implement this right now, so I’m not sure how I could add this 🙁
Regards,
Tobias
Do you think the new Plug-In Table2Chart would work with your tables?
http://wordpress.org/extend/plugins/table2chart
Hi,
thanks for that link. I don’t know that plugin yet, but will take a look. Depending on what data sources the plugin supports, using a TablePress table for that could indeed be possible. It looks like you’ll need a license for the actual JavaScript code though.
Regards,
Tobias
Hi,
I just took a quick look at the description of the Table2Chart plugin. From what I understand, it just takes the data from a table on the page. So, using that with a table that was created by TablePress should not be a problem.
Regards,
Tobias
Going to check it out now…
Hi,
note that charts as in your example don’t seem to be possible with that plugin, as charts can only be positioned outside of tables. Additionally, don’t forget that you seem to need a license to use the JavaScript code for that plugin (which is free for non-commercial use though, from what I can see).
Regards,
Tobias
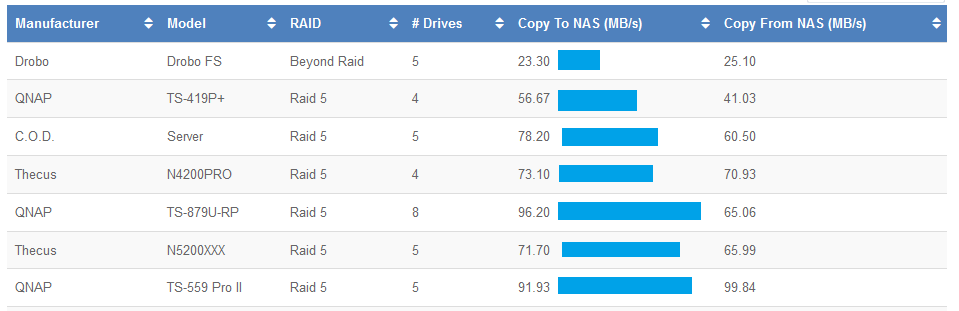
Its a decent start, but it doesn’t seem to recognize decimal points. instead of 98.67 it shows as 9,867
Got it.. .had to add convert=”false” to the shortcode
I did have to add a column to the table though that concatenates columns 1 & 2. It can’t be hidden either.
Hi,
very nice! Looks good indeed! I assume that the “Description” column is the extra column that you had to add.
While you can’t hide that via the “Edit” screen of TablePress (otherwise the information wouldn’t be available to Table2Chart), you can hide that via JavaScript.
Please try adding
"aoColumnDefs": [ { "bVisible": false, "aTargets": [ 4 ] } ]
to the “Custom Commands” textfield on the “Edit” screen of the table.
The 4 indicates that the 5th column shall be hidden (counting starts with 0 in that code).
Regards,
Tobias
Seems like if it is rendered on the page, the chart doesn’t work. Is there a way to make the column width for that column 0?
Hi,
Bummer. No, reducing the width to 0 is not possible, but there’s another way to hide the column, that could work:
Please add this to the “Custom CSS” textarea on the “Plugin Options” screen:
.tablepress-id-1 .column-5 {
    display: none;
}
Regards,
Tobias