Thread Starter
 kazu3
kazu3
(@kazu3)
Plugin Contributor
 helened
(@helened)
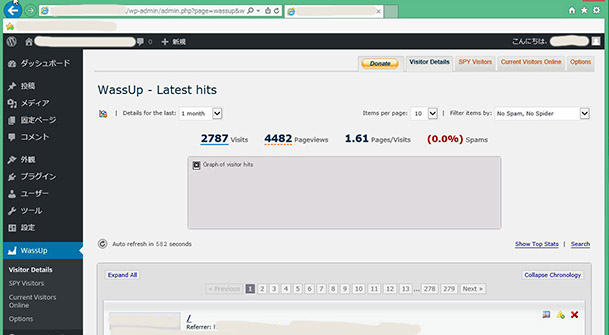
This could be the Google API issue that some IE11 users have reported.
I can see the chart fine in my copy of IE11, so the chart API does work in IE11 sometimes.
Try check your security level setting (medium works for me) or look at the emulation/Edge setting in F12 Developer tools and make sure that it is set for either “Default” or IE10.
Thread Starter
kazu3
(@kazu3)
From a problem occurs, but I waited three weeks, because there is no answer, and give up, you can install the Google analytics DashBoard, Wassup it was disabled.
Thank you.
Internet Options (O) security has changed mid, but did not resolve
Internet Options (O) security has been changed to cut had become to enter the protection mode, but did not resolve
F12 document mode of developers menu has changed the had become the Edge default to 10, but did not resolve
Plugin Contributor
helened
(@helened)
One IE11 user in the Google forum said that changing the URL for chart api link to http://chart.googleapis.com/chart fixed the problem for him. This url update will be in the next version of Wassup, coming soon.
If you want to try this fix now and you are familiar with PHP code, you can edit Wassup 1.8.6 plugin code to change the chart url:
In WordPress plugin editor, click the file “wassup/lib/main.php” and find lines #1908-1909 (near the bottom of the page, about 7/8 down):
// generate url for google chart image
$chart_url ="http://chart.apis.google.com/chart?chf=...
and change the host/domain portion of the url to:
// generate url for google chart image
$chart_url ="https://chart.googleapis.com/chart?chf=...
Thread Starter
kazu3
(@kazu3)
solved.
$chart_url =”https://chart.googleapis.com/chart?chf=…
Modify the main.php as directed, visitors graph is now displayed.
Thank you.
I want to try to compare with both the now google analytics dashboard and wassup.