Plugin Tag: visualization
-

Visualizer: Tables and Charts Manager for WordPress
Create responsive charts and tables manually or let the built-in AI build them from a simple text prompt. Supports multiple chart types and flexible d …
-

Chartify – WordPress Chart Plugin
Chartify is a powerful WordPress Chart Builder Plugin that will help you to create WordPress Graphs & Charts easily and quickly.
-
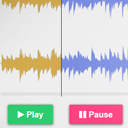
WaveSurfer-WP
Customizable HTML5 Audio controller with waveform preview (mixed or split channels), using WordPress native audio and playlist shortcode.
-
-

Internal Link Visualizer
Visualize your site's internal and external links as an interactive map. Discover orphan content and optimize your linking strategy.
-

WP SIMILE Timeline
Integrates the SIMILE Timeline into WordPress and provides an option interface for the various timeline settings.
-
-

Tally Graph
Add Google charts and graphs to your WordPress site based on tallies of any numeric custom field over time. Visualize progress toward any goal.
-

Data Diagrams: Visual Chart Editor for WordPress
Visual Editor for 33+ free responsive SVG data charts – as easy as adding an image. No technical skills needed. Live data. No external API calls.
-

Outline to Mind Map
Transform any text outline into a visual, interactive mind map to simplify complex ideas, like a game — no coding required.
-

Datapress
DataPress lets you publish rich, interactive data visualizations in your blog pages and posts.
-

Dashboard Posts Stats
Add a nice graph with your published posts during the last 30 days on a dashboard widget.
-

spoonacular recipe visualizer
Make your recipe blog look awesome with pretty and insightful visualizations.
-

Cloudstitch
Add the entire Cloudstitch library of spreadsheet-powered visualizations and widgets with just a shortcode.
-
-
-

DH Press – Digital Humanities Toolkit
DHPress is a flexible, repurposable, fully extensible digital public humanities toolkit designed for non-technical users.
-

VividWorks 3D E-Commerce Configurator
Online selling like in-store selling with full 3D visual product configurator
-

GW Chart Builder
Create and manage responsive charts directly in your WordPress admin. Supports multiple datasets, colors and live previews.
-

Chartlet
The lightest way to create beautiful, responsive charts in WordPress. No database clutter, no heavy libraries — just pure performance.